Sportpark Westvliet is a multi-sports park in Voorburg, Netherlands. Among others, it contains the grounds of VV Wilhelmus and the Voorburg Cricket Club. The first recorded match on the ground came in 2010 when Afghanistan played Scotland in a warm-up match for the 2010 World Cricket League Division One, which the Netherlands hosted. Despite having a boundary which is too short on one side, which is contrary to International Cricket Council regulation, the ground was nevertheless approved to hold One Day Internationals during the World Cricket League tournament. The first One Day International saw Afghanistan play Canada. Three further One Day Internationals were played there, however a further two matches were scheduled to be held there but were moved due to the pitch being deemed unsatisfactory. One Day International cricket returned to the ground in 2011 when the Netherlands played Kenya in the 2011-13 ICC Intercontinental Cup One-Day.
The ground is used by Voorburg Cricket Club, who previously played at Sportpark Duivesteijn and moved grounds in 2006, first playing at a reserve ground, before moving to Sportpark Westvliet in 2007.
Pitch Report
The Sportpark Hague is a balanced pitch. The pitch also helps both bowlers and batsman to play their vital role for their respective teams. Batsmen do get most runs but domination of bowlers increased nowadays. The venue hosted no ODI or Test Matches in the last 10 years and has hosted 5 T20Is matches.
T20I Match Pitch Report and Toss Factor:
The toss doesn’t play a vital role on this pitch as both the team chasing and defending seemed to have similar hands in the match. As of now the ground has witnessed 8 matches out of which the team batting first has won 4 matches and the team chasing has won 4 matches.
Here are last T20I matches average scores of both Innings at Sportpark ground:
T20I Matches 1st Innings Average Score – 155 runs
T20I Matches 2nd Innings Average Score – 137 runs
LAST 10 YEARS OUTCOME
ODI Stats
BATTING
Innings
Both
1st
2nd
BOWLING
Innings
Both
1st
2nd
HOWZAT
Innings
Both
1st
2nd
BATSMAN TYPE
Innings
Both
1st
2nd
WICKET TAKER
Innings
Both
1st
2nd
Batting leaders at SPORTPARK WESTVLIET STADIUM in odi matches
1
AJ Finch
SR 99.2
1
Innings
124
Runs
125
Balls
1
Outs
124
Avg
124
HS
12
4S
5
6S
0
50
1
100
2
AM Rahane
SR 87.05
2
Innings
121
Runs
139
Balls
2
Outs
60.5
Avg
70
HS
15
4S
0
6S
2
50
0
100
3
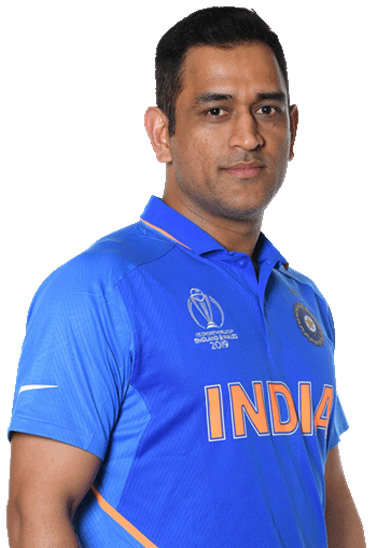
MS Dhoni
SR 103.26
2
Innings
95
Runs
92
Balls
0
Outs
0
Avg
92
HS
7
4S
4
6S
1
50
0
100
Bowling leaders at SPORTPARK WESTVLIET STADIUM in odi matches
1
AR Patel
SR 20
1
Innings
10
Overs
39
Runs
3
Wickets
3.9
Econ
13
Avg
03/039
BBI
0
4W
0
5W
3
4S
0
6S
30
Dots
2
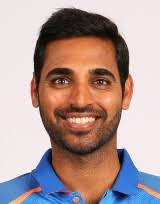
B Kumar
SR 37.33
2
Innings
18.4
Overs
93
Runs
3
Wickets
4.98
Econ
31
Avg
03/041
BBI
0
4W
0
5W
9
4S
2
6S
64
Dots
3
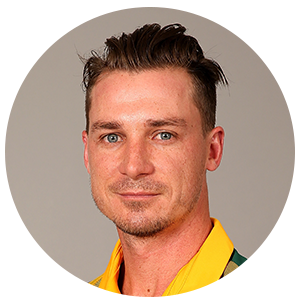
DW Steyn
SR 20
1
Innings
10
Overs
49
Runs
3
Wickets
4.9
Econ
16.33
Avg
03/049
BBI
0
4W
0
5W
7
4S
0
6S
38
Dots
T20 Stats
Total matches
8
Matches won batting first
4
Matches won bowling first
4
Average 1st Inns scores
155.25
Average 2nd Inns scores
137.25
Highest total recorded
167
Lowest total recorded
87
Highest score chased
157
Lowest score defended
150
BATTING
Innings
Both
1st
2nd
Matches
8
8
8
Won (1st bat)
4
4
4
Won (2nd bat)
4
4
4
No Result
0
0
0
Runs
2310
1242
1098
Highest Score
167
167
158
Lowest Score
87
128
87
Average
144.4
155.3
137.3
Balls Faced
1860
960
900
Strike Rate
124.2
129.4
122.0
100-149 Runs
6
2
4
150-199 Runs
9
6
3
200-249 Runs
0
0
0
250-299 Runs
0
0
0
300-349 Runs
0
0
0
350-399 Runs
0
0
0
400+ Runs
0
0
0
4s
183
94
89
6s
65
40
25
Avg 4/6
10./4.5
11.6/3.6
9.0/5.3
BOWLING
Innings
Both
1st
2nd
Matches
8
8
8
Balls
1860
960
900
Runs
2310
1242
1098
Average Run/Wkt
20.6
21.1
20.7
Strike Rate
16.6
16.3
17.0
Maiden
3
2
1
3-4 Wickets
1
0
1
5-7 Wickets
7
5
2
8-9 Wickets
4
2
2
10 Wickets
3
1
2
Wickets
112
59
53
lbw
11
4
7
bowled
29
13
16
stumped
2
1
1
catch
61
36
25
HOWZAT
Innings
Both
1st
2nd
lbw
11
4
7
bowled
29
13
16
stumped
2
1
1
catch
61
36
25
run out
9
5
4
Hit Wicket
0
0
0
BATSMAN TYPE
Innings
Both
1st
2nd
Right Handed
86
44
42
1- LBW
8
3
5
2- Bowled
22
9
13
3- Stumped
2
1
1
4- Catch
47
27
20
Left Handed
25
15
10
1- LBW
3
1
2
2- Bowled
7
4
3
3- Stumped
0
0
0
4- Catch
14
9
5
WICKET TAKER
Innings
Both
1st
2nd
Left Arm
24
12
12
1- Fast
0
0
0
2- Fast-Medium
2
0
2
3- Medium
0
0
0
4- Spinner
22
12
10
1- Bowled
9
3
6
2- Catch
12
8
4
3- Stumped
1
1
0
4- Lbw
2
0
2
Right Arm
79
42
37
1- Fast
5
3
2
2- Fast-Medium
36
23
13
3- Medium
16
9
7
4- Spinner
22
7
15
1- Bowled
20
10
10
2- Catch
49
28
21
3- Stumped
1
0
1
4- Lbw
9
4
5
Batting leaders at SPORTPARK WESTVLIET STADIUM in t20 matches
1
Tamim Iqbal
SR 123.89
3
Innings
140
Runs
113
Balls
2
Outs
70.00
Avg
69
HS
9
4S
3
6S
2
50
0
100
2
Ashfaq Ahmed
SR 139.36
2
Innings
131
Runs
94
Balls
2
Outs
65.50
Avg
75
HS
16
4S
4
6S
2
50
0
100
3
MR Swart
SR 131.11
2
Innings
118
Runs
90
Balls
2
Outs
59.00
Avg
61
HS
8
4S
4
6S
2
50
0
100
4
MP O'Dowd
SR 118.52
7
Innings
224
Runs
189
Balls
6
Outs
37.33
Avg
65
HS
16
4S
5
6S
2
50
0
100
5
BFW de Leede
SR 114.11
5
Innings
186
Runs
163
Balls
3
Outs
62
Avg
66
HS
14
4S
4
6S
2
50
0
100
6
SA Edwards
SR 112.1
8
Innings
139
Runs
124
Balls
7
Outs
19.86
Avg
29
HS
13
4S
3
6S
0
50
0
100
Bowling leaders at SPORTPARK WESTVLIET STADIUM in t20 matches
1
Abdur Razzak
SR 14.40
3
Innings
12
Overs
86
Runs
5
Wickets
7.17
Econ
17.20
Avg
2/23
BBI
0
4W
0
5W
5
4S
4
6S
30
Dots
2
Shakib Al Hasan
SR 14.40
3
Innings
12
Overs
88
Runs
5
Wickets
7.33
Econ
17.60
Avg
2/23
BBI
0
4W
0
5W
8
4S
4
6S
32
Dots
3
Mashrafe Mortaza
SR 12.00
2
Innings
8
Overs
44
Runs
4
Wickets
5.50
Econ
11.00
Avg
2/22
BBI
0
4W
0
5W
5
4S
1
6S
28
Dots
4
LV van Beek
SR 13.2
6
Innings
22
Overs
151
Runs
10
Wickets
6.86
Econ
15.1
Avg
13-Mar
BBI
0
4W
0
5W
11
4S
6
6S
63
Dots
5
MR Adair
SR 10.29
3
Innings
12
Overs
91
Runs
7
Wickets
7.58
Econ
13
Avg
01-Mar
BBI
0
4W
0
5W
5
4S
4
6S
32
Dots
6
VJ Kingma
SR 15.29
5
Innings
17.5
Overs
143
Runs
7
Wickets
8.02
Econ
20.43
Avg
21-Apr
BBI
1
4W
0
5W
17
4S
4
6S
48
Dots
IN LAST 10 YEARS NO MATCHES ARE PLAYED
Test Stats
BATTING
Innings
Both
1st
2nd
3rd
4th
BOWLING
Innings
Both
1st
2nd
3rd
4th
HOWZAT
Innings
Both
1st
2nd
3rd
4th
Batting leaders at SPORTPARK WESTVLIET STADIUM in test matches
1
AM Rahane
SR 51.83
3
Innings
297
Runs
573
Balls
2
Outs
148.5
Avg
188
HS
30
4S
4
6S
1
50
1
100
2
MA Agarwal
SR 73.64
1
Innings
243
Runs
330
Balls
1
Outs
243
Avg
243
HS
28
4S
8
6S
0
50
1
100
3
Virat Kohli
SR 57.58
3
Innings
228
Runs
396
Balls
3
Outs
76
Avg
211
HS
21
4S
0
6S
0
50
1
100
Bowling leaders at SPORTPARK WESTVLIET STADIUM in test matches